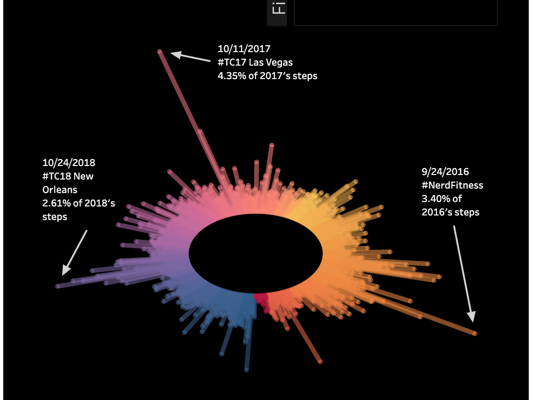
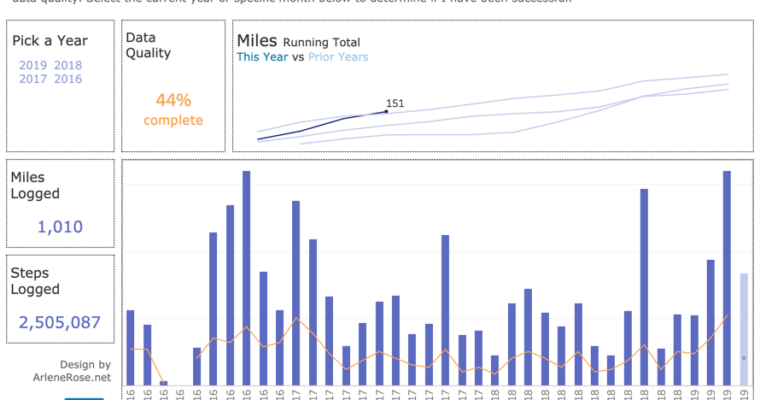
Home

Activity tracking

Activity tracking

Another FitBit Dashboard. The usage of BANs (Big A** Numbers) is helpful in visualization best practices. I also threw in a sparkline so that you can really quickly see if I’m going to get more steps than prior years. I need to step it up.

Why do my feet hurt?

Why do my feet hurt?

If you haven’t automated your data with IFTTT yet, you should check it out! I have IFTTT.com set up to log to google drive every time I sync my fitbit steps to my phone. update 4/6/19 broke it out by year:

A Year of Knoxville Rainfall

A Year of Knoxville Rainfall

Recent flooding in my hometown lead me to wonder how much rain did we get in one day compared to a normal year.

Valentine Conundrum

Valentine Conundrum

#MakeOverMonday 2017 – Week 7 Less people are celebrating Valentine’s day. However spending on the holiday has increased 12%. Why?

Inflation Rates by U.S. President

Inflation Rates by U.S. President

Hover to see details. The bar across each presidential term is the average for that entire term.  

Unemployment Rates by U.S. President

Unemployment Rates by U.S. President

Welcome to my series on key economic indicators. I thought it would be interesting to slice by U.S. President. Hover over the barchart to see more details.This data comes from the U.S. Bureau of Labor Statistics  

NFL Arrests Data

NFL Arrests Data

I’m not your typical sports fan. As in, I don’t follow football at all. However, we had a team project to do something with this data. Here is what I came up with…