How Much of A Typical American Paycheck Goes To Pay Their Mortgage #MakeOverMonday 2018W47
How Much of A Typical American Paycheck Goes To Pay Their Mortgage https://data.world/makeovermonday/2018w47
Making the world a better place by helping people understand their data.
How Much of A Typical American Paycheck Goes To Pay Their Mortgage https://data.world/makeovermonday/2018w47

Sitting in the front of a room with 15,000 other people waiting for Adam Grant to kick off the day three keynote and this photo popped up! From left to right: David Pires @davidmpires Katie Fontenot Wagner @ktfontnowagner Vince Baumel @quantum_relic Me 🙂 @WhimSQL Adam…
This is a fun remake of an older dashboard I did… Bubbles gets his name from a TV show called the “Wire“. 🙂 This data should update regularly. Enjoy 🙂 Here is the dashboard on Tableau Public.
My #MakeOverMonday contribution for 11.5.2018
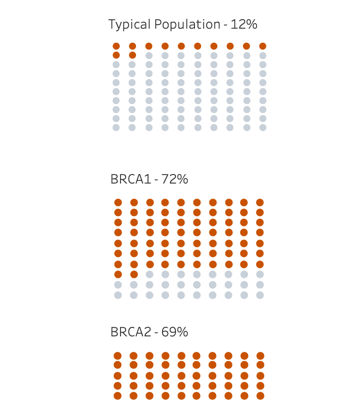
A dashboard I put together to show chances of a Breast Cancer diagnosis in a person’s lifetime (this impacts men too)